This post is about performance monitoring Azure Virtual Desktop (AVD) with Azure monitor. This features the CPU, RAM, Disk utilization, and more.
The log analytics agent will be deprecated in 2024:

You can check out the Microsoft docs here.
This post features the manual configuration via the Azure portal and an automated configuration via Bicep and Azure CLI. (Skip to the bottom to see that immediately.)
I assume you already set up Azure Virtual Desktop and have Virtual Machines running. If you do not. Please check out these posts to setup AVD with automation in mind:
Create AVD image with Packer & Azure DevOps
Create AVD Sessionhosts with Bicep
Manual setup – Monitoring AVD with Azure Monitor
So, what do you need to do to set this up? There is the manual way and the automated way. Let’s start with the manual setup.
Firstly, go to “Monitor” in the Azure Portal:

After that, go to Virtual Machines -> Overview -> Not monitored, you probably see a couple of machines here:

Click on Enable for a virtual machine and you see this:

Click on Enable again and you’re asked to create a data collection rule:

This creates a new data collection rule in a new log analytics workspace, and it enables managed identities for your Virtual Machines. In addition, the names are generated and not all features are enabled. We want a bit more control. So, please click on “Create New“:

After that, you can set your name, enable MAP, and pick your preferred Log Analytics workspace:

In addition, create a Log Analytics workspace if you don’t have one. For this demo, I went with the generated one.
Lastly, click on configure and the deployment starts.
As a result, these resources get deployed:

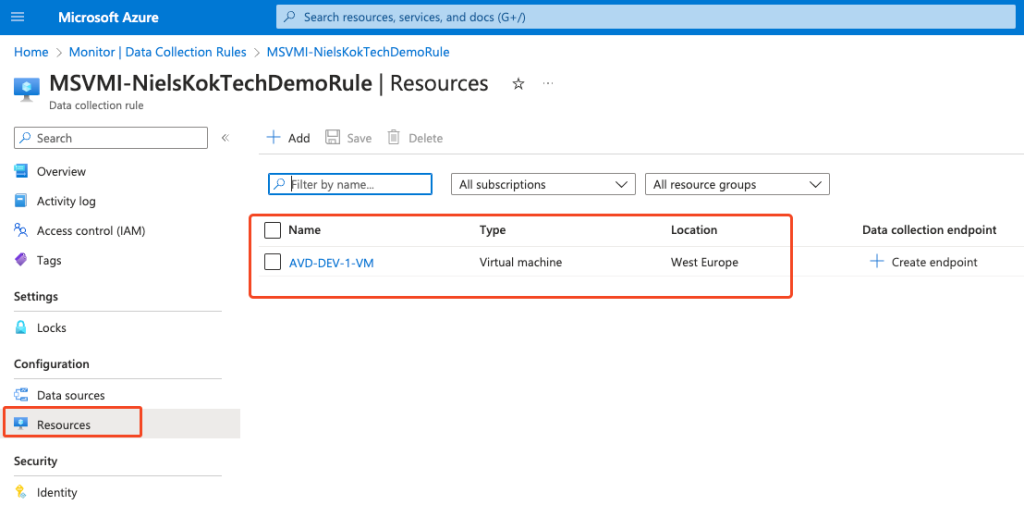
So, when we go back to Azure Monitor and check out the data collection rules. We see the rule created and the Virtual Machine connected:


When we go back to the Azure Monitor, we see that performance monitoring has started:

Automated setup – Monitoring AVD with Azure Monitor
The manual setup is all fine and dandy but we can’t be doing this every time we run a new deployment. That is time-consuming, to say the least. So, what does the automated version of the blog above look like?
Firstly, we create the data collection rule and we do so by using a Bicep template.
This is the Bicep template:
Link to Github
Edit the parameters in the template (or set these in the deployment command):

Run the template using Azure CLI and these commands:
az login

az account set --subscription "YOUR SUBSCRIPTION NAME"

az group create --location WestEurope --name "ResourceGroupName"

az deployment group create `
    --resource-group "ResourceGroupName" `
    --template-file "Path to DataCollectionRule.bicep"
(Edit the variables accordingly)
When the deployment is finished, you have a new data collection rule:

After that, we need to associate the new data collection rule with a virtual machine to get the monitoring started.
We do so by deploy a bicep template.
Link to Github.
Change the parameters accordingly:

Use these commands to deploy the template again:
az login

az account set --subscription "YOUR SUBSCRIPTION NAME"

az group create --location WestEurope --name "ResourceGroupName"

az deployment group create `
    --resource-group "ResourceGroupName" `
    --template-file "Path to DataCollectionRule.bicep"
As a result, my second machine is added to monitoring!

That concludes this blog. I showed the manual and the automated configuration steps for deploying the Azure Monitor solution.
